Destinations for Key Stage 5 students who completed in 2010. Are they Valuable?
In July 2013, the DfE released data for where young people went at 18. This covers the destinations of those who completed level 3 courses in 2010. Whilst you could believe that the data is a little out of date and that the introduction of increased fees haven’t been taken into account, there are some key messages which make interesting reading.
The data we have presented are split into two categories. Any Education destination essentially is any Higher Education/FE or sixth form college/Apprenticeship placement. A Sustained Employment/Training destination is a job which offers formalised training or a form of training but not an apprenticeship.
We have investigated a little into the detail behind the figures to give you a flavour of the data content and what they may mean for you.
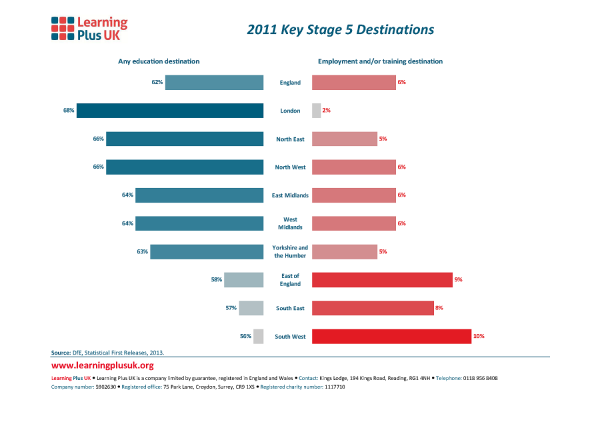
The comparison between the national picture and the regions is valuable. The overall England picture shows 62% go to an education destination and 6% enter Sustained Employment/Training giving a total of 68%. Of those 62%, 48% went into Higher Education with 8% going into Further Education (including courses such as Art Foundation), 3% going to sixth form school /college and 3% into apprenticeships.
London has the least percentage of leavers entering the Sustained Employment /Training category and the highest number entering Any Education destinations (68%). This would suggest that for level 3 completers many jobs in London offered structured and formalised training such as apprenticeships.
Conversely the areas showing the highest percentages into Sustained Employment/Training opportunities the South West, the East of England and the South East appear to have more job opportunities which don’t contain training recognised through apprenticeships. These 3 areas overall have the lowest combined figures nationally for participation in the two measures, all below the national average with 67% East of England, 66% South West and 65% South East. Questions over quality of employment and possibly high NEET levels are pertinent here.
The North West and North East show the highest combined figures nationally 72% and 71% respectively. Both were 2% below London for entrance into Any Education. The North East included a very high 6% apprenticeship figure.
The East and West Midlands had identical figures having the same as the national figure for entry into Sustained Employment / Training, with Other Education figures above the national average by 2%.
Yorkshire and the Humber had 63% into Other Education and 5% into Sustained Employment/Training together matching the national average of 68%.
No regional patterns seem to emerge. Many will be surprised by the contrast between the South East and the North West. Indeed with the exception of London the south of the country is below combined averages for the Midlands and the North and well below the national average for entrance into Other Education.
Key questions for Heads of Sixth Forms and other leaders are:
- Do you know where your level 3 completers are going?
- Have you got robust data?
- Do you collect the data quickly enough to benefit students?
- Can you distinguish between positive outcomes and other outcomes?
Learning Plus UK are committed to providing Post-16 leaders with timely and reliable data that helps inform decision making and planning. We are carefully building destination profiles into the Post-16 LPUK Datadashboard©. We are interested to hear your views on the development of destination data at KS5 and how we can help you further. So email us your thoughts or join our discussion forums on linkedin or Facebook.